
A Major Level for the NASDAQ is Back in Play
We’ve had a strong selloff across the board over the last two sessions, and it’s looking like bearish sentiment may be taking over. But if we look at he chart for the NASDAQ 100 ($NDX) we are now testing a level that has served as both support and resistance over the last few months.
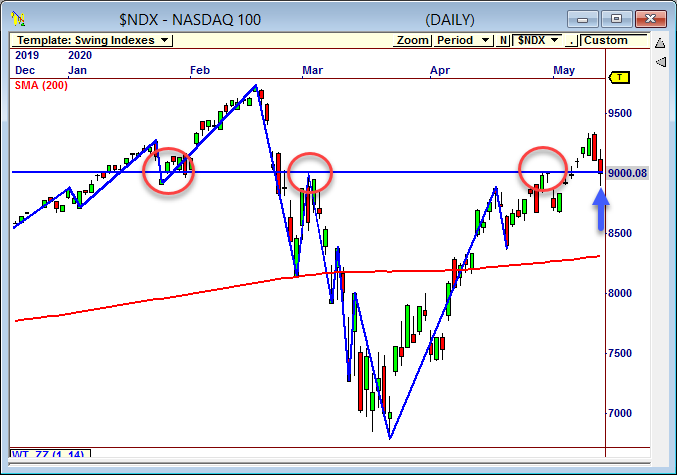
The NASDAQ closed at 9000 in today’s session. I don’t mean near 9000, it closed RIGHT AT 9000! Why is that meaningful? The chart above shows that this level has been reacted to at least three times this year.
In late January, 9000 served as short term support, which led to a strong run over the next month. Once 9000 was breached in late February, it was retested as resistance in early March. This time, it did serve as strong resistance and the index fell hard and fast after the test.
The level was tested yet again in late April. We didn’t see the strong reaction we saw on the previous tests, but it served as very short term resistance. And now it is setting right on top of this level heading into Thursday’s session.
So will it hold as support this time? As traders, we don’t need to know that – we just need to incorporate this level into our trading decisions. A bounce off of 9000 should bring the bulls heavily back into the market. Of course, if the index falls through this level we should see strong selling pressure drive the index significantly lower.
Jeff Drake