S&P 500 – Poised for a Breakout?
We talked last week about the NASDAQ testing a very important level, and now we have another major index in a similar position. The S&P 500 closed near the same level it closed at in Friday’s session. This looks to be providing us with a stellar setup.
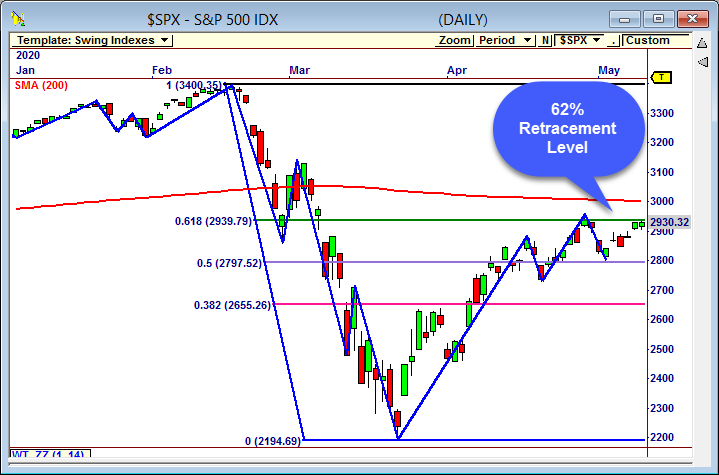
The green line on the chart represents the 62% Fibonacci Retracement Level. This means that the index index value has moved about 62% back into the range created by the high in mid-February and the low in late March. When this happens, whether it be an index, stock, futures contract, or any other security, we need to watch closely as we often get a pullback (retracement) from this level.
But that’s not all! We need to also take note of the last high pivot point established a couple of weeks ago. This shows that the 62% retracement level was previously honored, so we now have potential resistance to consider as well.
Yes, I know, it’s a news driven market. But aren’t they all? It’s just that the current news is very heavily one-sided. That said, we have already seen these technical levels help us make trading decisions recently. Watch the S&P’s reaction to the retracement/resistance level closely. Whether it breaks through or pulls back, you’ll have an edge on your trading decisions by watching the markets reaction.
Jeff Drake
True Edge Trading